Cursors#
An introduction to selecting phasor coordinates using cursors.
Import required modules, functions, and classes:
import matplotlib.pyplot as plt

from phasorpy.color import CATEGORICAL
from phasorpy.cursors import (
    mask_from_circular_cursor,
    mask_from_elliptic_cursor,
    mask_from_polar_cursor,
    pseudo_color,
)
from phasorpy.datasets import fetch
from phasorpy.io import read_lsm
from phasorpy.phasor import phasor_from_signal, phasor_threshold
from phasorpy.plot import PhasorPlot
Open a hyperspectral dataset used throughout this tutorial:
signal = read_lsm(fetch('paramecium.lsm'))
mean, real, imag = phasor_from_signal(signal, axis=0)

# remove coordinates with zero intensity
mean_thresholded, real, imag = phasor_threshold(mean, real, imag, mean_min=1)
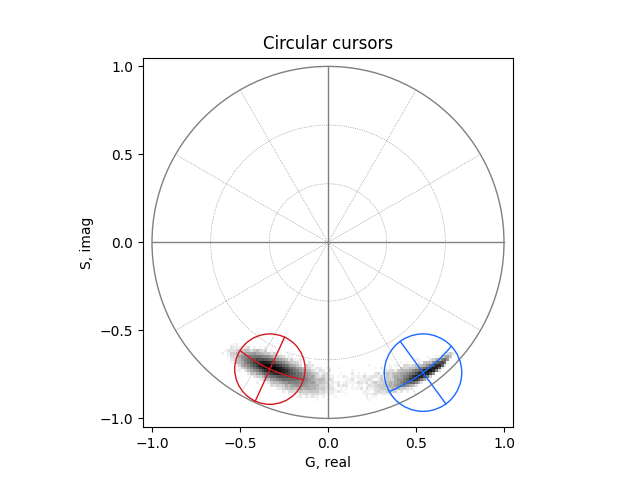
Circular cursors#
Use circular cursors to mask regions of interest in the phasor space:
cursors_real = [-0.33, 0.54]
cursors_imag = [-0.72, -0.74]
radius = [0.2, 0.22]

circular_mask = mask_from_circular_cursor(
    real, imag, cursors_real, cursors_imag, radius=radius
)
Show the circular cursors in a phasor plot:
plot = PhasorPlot(allquadrants=True, title='Circular cursors')
plot.hist2d(real, imag, cmap='Greys')
for i in range(len(cursors_real)):
    plot.cursor(
        cursors_real[i],
        cursors_imag[i],
        radius=radius[i],
        color=CATEGORICAL[i],
        linestyle='-',
    )
plot.show()
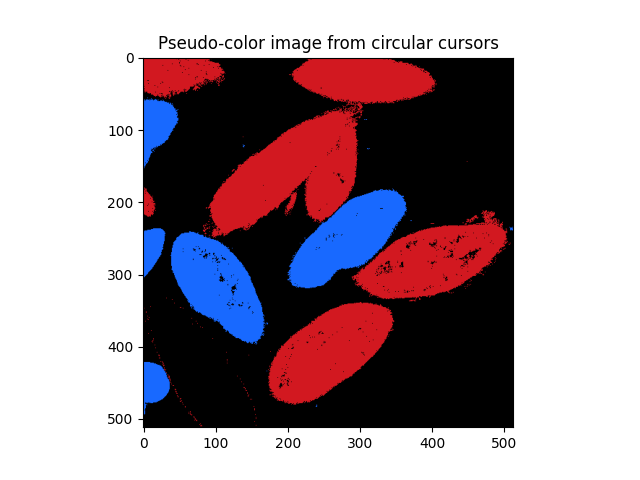
The cursor masks can be blended to produce a pseudo-colored image:
pseudo_color_image = pseudo_color(*circular_mask)

fig, ax = plt.subplots()
ax.set_title('Pseudo-color image from circular cursors')
ax.imshow(pseudo_color_image)
plt.show()
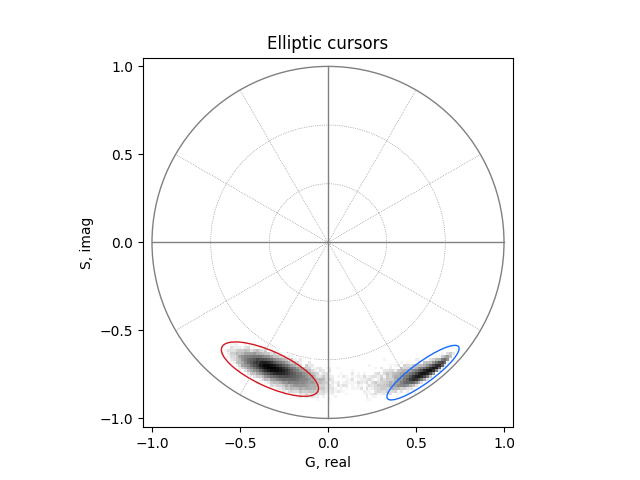
Elliptic cursors#
Use elliptic cursors to mask more defined regions of interest in the phasor space:
radius = [0.1, 0.06]
radius_minor = [0.3, 0.25]

elliptic_mask = mask_from_elliptic_cursor(
    real,
    imag,
    cursors_real,
    cursors_imag,
    radius=radius,
    radius_minor=radius_minor,
)
Show the elliptic cursors in a phasor plot:
plot = PhasorPlot(allquadrants=True, title='Elliptic cursors')
plot.hist2d(real, imag, cmap='Greys')
for i in range(len(cursors_real)):
    plot.cursor(
        cursors_real[i],
        cursors_imag[i],
        radius=radius[i],
        radius_minor=radius_minor[i],
        color=CATEGORICAL[i],
        linestyle='-',
    )
plot.show()
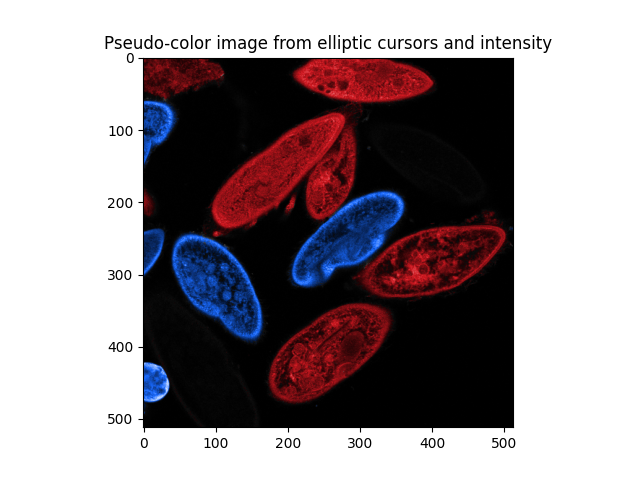
The mean intensity image can be used as a base layer to overlay the masks from the elliptic cursors:
pseudo_color_image = pseudo_color(*elliptic_mask, intensity=mean)

fig, ax = plt.subplots()
ax.set_title('Pseudo-color image from elliptic cursors and intensity')
ax.imshow(pseudo_color_image)
plt.show()
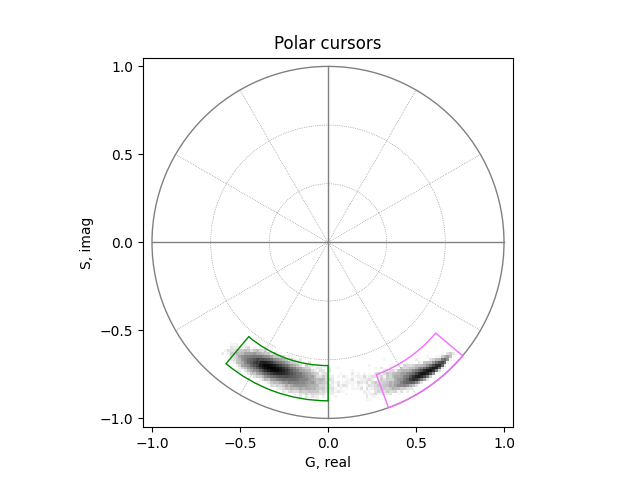
Polar cursors#
Create a mask with two ranges of phase and modulation values:
phase_min = [-2.27, -1.22]
phase_max = [-1.57, -0.70]
modulation_min = [0.7, 0.8]
modulation_max = [0.9, 1.0]

polar_mask = mask_from_polar_cursor(
    real, imag, phase_min, phase_max, modulation_min, modulation_max
)
Show the polar cursors in a phasor plot:
plot = PhasorPlot(allquadrants=True, title='Polar cursors')
plot.hist2d(real, imag, cmap='Greys')
for i in range(len(phase_min)):
    plot.polar_cursor(
        phase=phase_min[i],
        phase_limit=phase_max[i],
        modulation=modulation_min[i],
        modulation_limit=modulation_max[i],
        color=CATEGORICAL[i + 2],
        linestyle='-',
    )
plot.show()
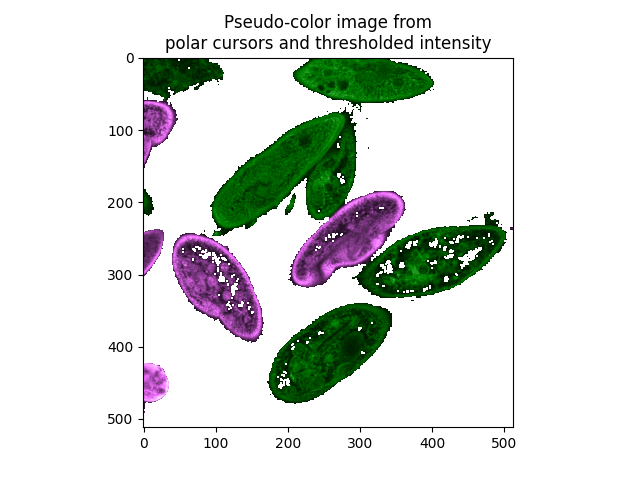
The thresholded mean intensity image can be used as a base layer to overlay the masks from the polar cursors. Values below the threshold are transparent (white):
pseudo_color_image = pseudo_color(
    *polar_mask, intensity=mean_thresholded, colors=CATEGORICAL[2:]
)

fig, ax = plt.subplots()
ax.set_title(
    'Pseudo-color image from\npolar cursors and thresholded intensity'
)
ax.imshow(pseudo_color_image)
plt.show()
sphinx_gallery_thumbnail_number = 1 mypy: allow-untyped-defs, allow-untyped-calls mypy: disable-error-code=”arg-type”
Total running time of the script: (0 minutes 0.563 seconds)